
Understanding Core Web Vitals: The Key to Better User Experience and SEO
In today’s digital landscape, website performance has become a critical factor in determining online success. Google’s Core Web Vitals have emerged as the gold standard for measuring user experience on the web. These metrics not only impact how visitors perceive your site but also play a significant role in how search engines rank your pages. Let’s dive into what Core Web Vitals are, why they matter, and how you can optimize them for better performance.
What Are Core Web Vitals?
Core Web Vitals are a set of specific factors that Google considers important in a webpage’s overall user experience. They are part of Google’s Page Experience signals used in ranking algorithms. The three main Core Web Vitals metrics focus on loading performance, interactivity, and visual stability:
- Largest Contentful Paint (LCP) – measures loading performance
- First Input Delay (FID) – measures interactivity (or Total Blocking Time (TBT) in lab tests)
- Cumulative Layout Shift (CLS) – measures visual stability
It’s important to note that when using tools like Google’s PageSpeed Insights, you’ll see additional metrics beyond these three Core Web Vitals, including First Contentful Paint (FCP) and Speed Index, which provide a more comprehensive view of your page’s performance.
Why Are Core Web Vitals Important?
SEO Impact
Since May 2021, Core Web Vitals have been incorporated as ranking signals in Google’s algorithm. This means that websites with good Core Web Vitals scores are more likely to rank higher in search results, potentially leading to increased visibility and traffic. While content relevance remains king, page experience has become the differentiating factor when content quality is equal.
Competitive Advantage
In competitive markets, every advantage counts. When your competitors offer similar products, services, or content, superior user experience can be the deciding factor for visitors choosing between multiple options. Optimized Core Web Vitals help you stand out in a crowded digital marketplace.
Reduced Bounce Rates
Poor page performance directly correlates with higher bounce rates. Research shows that 53% of mobile site visitors will leave a page that takes longer than three seconds to load. By improving your Core Web Vitals, you can significantly reduce bounce rates and keep users engaged with your content.
Improved Conversion Rates
User experience directly impacts conversion rates. Studies have demonstrated that even a 0.1-second improvement in site speed can boost conversion rates by up to 8%. Fast, responsive, and stable websites inspire confidence and encourage users to complete desired actions.
The User Experience Perspective
At their core, Core Web Vitals are about providing an excellent user experience. They measure aspects of web pages that users genuinely care about:
The Speed Factor
Loading speed is perhaps the most immediately noticeable aspect of a website’s performance. When pages load quickly, users can access content faster and begin their journey without frustration. LCP addresses this by measuring how quickly the largest content element (like an image or text block) becomes visible.
Responsive Interactions
Nothing frustrates users more than clicking a button or link and experiencing a delay before anything happens. FID measures how quickly a website responds to user interactions, ensuring that buttons, forms, and navigation elements respond promptly when users interact with them.
Visual Stability
Have you ever tried to click a button, only to have it move at the last second because some content loaded and shifted the page layout? This jarring experience, known as layout shift, can be incredibly frustrating. CLS measures and helps minimize these unexpected layout shifts.
CLS: Beyond User Experience
Cumulative Layout Shift (CLS) deserves special attention not only for its impact on user experience but also for its role in fraud prevention. When elements shift unexpectedly on a page, users may accidentally click advertisements, malicious links, or unwanted subscription buttons.
This type of layout shift has historically been exploited by dishonest site owners who deliberately design pages where buttons or content move at strategic moments, tricking users into clicking elements they didn’t intend to. By measuring and penalizing excessive layout shifts, Google is effectively discouraging these deceptive practices, making the web safer for all users.
A stable page layout ensures that users interact with exactly what they intend to, reducing accidental clicks and potential exposure to fraudulent content or unwanted subscriptions.
Understanding All Performance Metrics in Detail
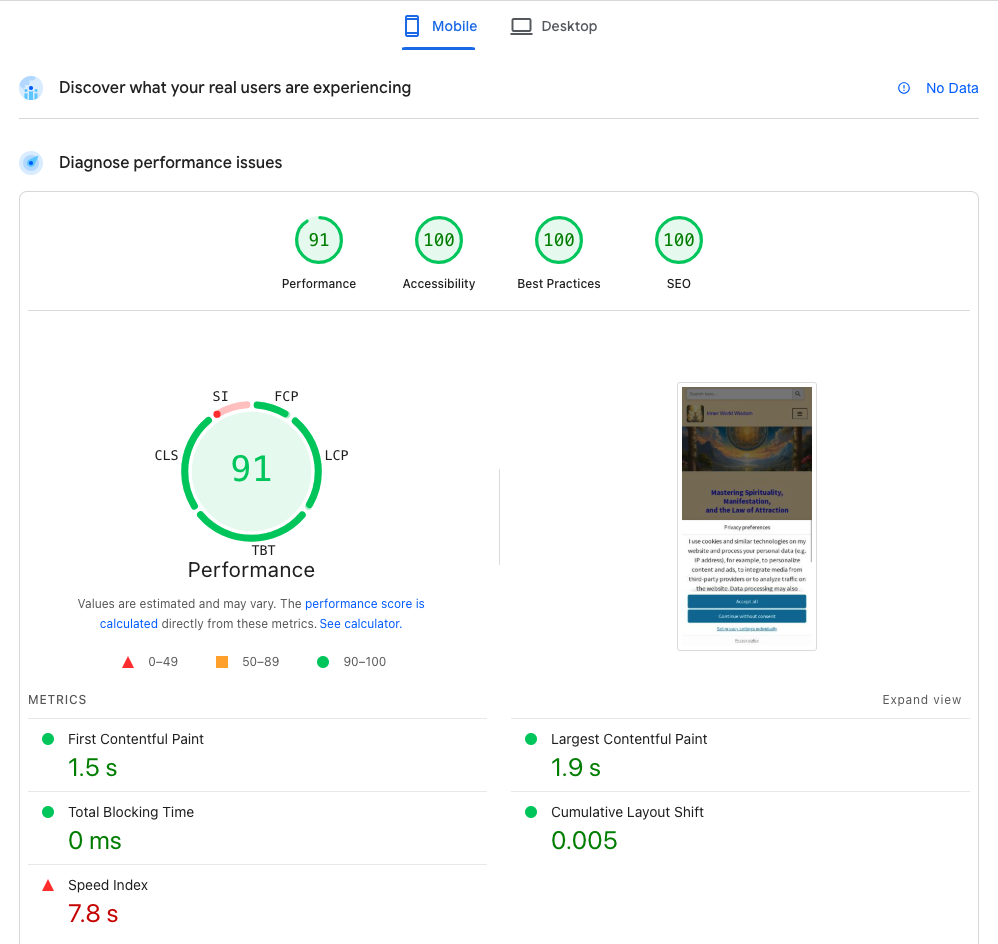
Core Web Vitals for mobile devices – with preloaded CDN cache.
First Contentful Paint (FCP)
FCP measures the time from when the page starts loading to when any part of the page’s content is rendered on the screen. This is the first milestone in page loading that users experience.
What Makes a Good FCP Score?
- Good: 1.8 seconds or faster
- Needs Improvement: Between 1.8 and 3.0 seconds
- Poor: Longer than 3.0 seconds
Common FCP Issues and Solutions:
- Render-blocking resources
- Multiple page redirects
- Slow server response time
- Large network payloads
To improve FCP, focus on eliminating render-blocking resources, implementing critical CSS, and optimizing your server response time.
Largest Contentful Paint (LCP)
LCP measures the time it takes for the largest content element visible within the viewport to be rendered. This could be an image, video, or block of text. This is one of the three official Core Web Vitals.
What Makes a Good LCP Score?
- Good: 2.5 seconds or faster
- Needs Improvement: Between 2.5 and 4 seconds
- Poor: Longer than 4 seconds
Common LCP Issues and Solutions:
- Slow server response times
- Render-blocking JavaScript and CSS
- Slow resource load times
- Client-side rendering
To improve LCP, consider optimizing your server, implementing caching strategies, optimizing and compressing images, and using content delivery networks (CDNs).
Total Blocking Time (TBT)
TBT measures the total amount of time that a page is blocked from responding to user input, such as mouse clicks, screen taps, or keyboard presses. It’s calculated by summing the blocking portions of all long tasks between First Contentful Paint and Time to Interactive. In lab testing environments, TBT serves as a proxy for First Input Delay (FID), which is the Core Web Vital that measures interactivity in the field.
What Makes a Good TBT Score?
- Good: 200 milliseconds or less
- Needs Improvement: Between 200 and 600 milliseconds
- Poor: More than 600 milliseconds
Common TBT Issues and Solutions:
- Heavy JavaScript execution
- Long tasks that block the main thread
- Excessive third-party code
To improve TBT (and consequently FID), consider breaking up long tasks, optimizing JavaScript execution, reducing JavaScript execution time, and minimizing third-party impact.
Speed Index
Speed Index measures how quickly content is visually displayed during page load. It’s the average time at which visible parts of the page are displayed. Unlike the other metrics that capture specific moments or elements, Speed Index evaluates the visual completeness of a page throughout the loading process.
What Makes a Good Speed Index Score?
- Good: 3.4 seconds or faster
- Needs Improvement: Between 3.4 and 5.8 seconds
- Poor: Longer than 5.8 seconds
Common Speed Index Issues and Solutions:
- Render-blocking resources
- Unoptimized images
- Excessive DOM size
- Inefficient code splitting
To improve Speed Index, focus on optimizing critical rendering path, implementing lazy loading for non-critical resources, and ensuring proper resource prioritization.
Cumulative Layout Shift (CLS)
CLS measures the sum of all unexpected layout shifts that occur during the entire lifespan of the page. A layout shift occurs any time a visible element changes its position from one rendered frame to the next. This is one of the three official Core Web Vitals.
What Makes a Good CLS Score?
- Good: 0.1 or less
- Needs Improvement: Between 0.1 and 0.25
- Poor: Greater than 0.25
Common CLS Issues and Solutions:
- Images without dimensions
- Ads, embeds, and iframes without dimensions
- Dynamically injected content
- Web fonts causing FOIT/FOUT (Flash of Invisible/Unstyled Text)
To improve CLS, always include width and height attributes on images and video elements, reserve space for ads, embed, and iframes, avoid inserting content above existing content, and use the font-display CSS feature to ensure text remains visible during font loading.
Measuring Your Web Performance Metrics
The best way to measure your site’s performance metrics, including Core Web Vitals, is through Google’s PageSpeed Insights, which provides detailed analysis and recommendations for both mobile and desktop versions of your site. When using PageSpeed Insights, you’ll see all five metrics discussed above: First Contentful Paint, Largest Contentful Paint, Total Blocking Time (as a lab equivalent to First Input Delay), Speed Index, and Cumulative Layout Shift.
Other excellent tools include:
- Google Search Console – Provides a dedicated Core Web Vitals report
- Lighthouse – Available in Chrome DevTools
- Chrome User Experience Report – Provides real-world user experience metrics
- Web Vitals JavaScript library – For measuring Core Web Vitals programmatically
- GTmetrix – Provides additional performance metrics and recommendations
Understanding Test Server Locations and CDN Impact
When measuring Core Web Vitals, particularly through tools like PageSpeed Insights, it’s crucial to understand where the measurement servers are located and how this affects your results. This knowledge can dramatically impact your optimization strategy and testing approach.
Test Server Locations
PageSpeed Insights and Lighthouse tests are predominantly run from Google’s data centers in North America, specifically in North Virginia (US-East region). This means that regardless of where your website’s target audience is located, the lab data you see in these tools reflects the experience of a user accessing your site from the United States.
PageSpeed Insights combines two types of data:
- Lab Data: Real-time measurements collected from US-based servers
- Field Data: Aggregated from the Chrome User Experience Report (CrUX), representing actual users worldwide
The CDN Cache Factor
Content Delivery Networks (CDNs) work by caching your website’s assets across multiple servers worldwide. When a user accesses your site, they’re served content from the nearest CDN edge location. However, if the assets aren’t already cached at that location (a “cold cache”), the CDN must first retrieve them from your origin server, resulting in slower load times. See this tech blog article to learn more about the CDN advantage.
When PageSpeed Insights tests your site, it’s accessing it from US servers. If your CDN doesn’t have your content cached in its US edge locations, your performance scores will suffer significantly.
Real-World Impact Example
Consider this real case study: A website’s mobile performance score increased from 88% to 91% simply by preloading the CDN cache using a US-based IP address (via VPN) before running the test. More importantly, the Largest Contentful Paint (LCP) decreased from 2.6 seconds to 1.9 seconds, while First Contentful Paint improved to 1.5 seconds—both now well under the threshold for “good” performance.
These improvements came not from any code changes or optimizations, but simply from ensuring the content was already cached in CDN locations near the testing servers.
Strategies for Accurate Testing
To get the most accurate and optimized Core Web Vitals measurements:
- Preload Your CDN Cache (if you use one): Before running performance tests, visit your website using a VPN with an IP address from the US East region. This will ensure your content is cached in CDN edge locations near the testing servers.
- Run Multiple Tests: Performance can vary based on network conditions and server load. Run several tests at different times to get a more accurate picture.
- Consider Geographic Distribution: If your target audience is primarily outside the US, also test your site using tools or VPNs that connect from those regions to understand the actual user experience there.
- Distinguish Between “Cold” and “Warm” Cache Tests: For a comprehensive understanding, conduct tests with both cold caches (first-time visit) and warm caches (repeat visit). This helps you identify opportunities to optimize the initial load experience.
- Implement Cache Warming: For critical pages, implement automated cache warming strategies that periodically request content to keep it fresh in CDN caches worldwide.
CDN Best Practices for Core Web Vitals
- Choose CDN Providers with Broad Geographic Coverage: Ensure your CDN has edge locations in regions where your users are located.
- Optimize Cache TTL (Time-To-Live): Configure appropriate cache durations for different types of content to minimize cache misses.
- Implement Cache Purging Strategies: When content updates, use targeted cache purging rather than clearing the entire cache.
- Leverage CDN Features: Many CDNs offer built-in image optimization, minification, and compression services that can further improve Core Web Vitals. However, be careful to thoroughly test any of these “improvements” as some may unexpectedly decrease your site performance.
- Monitor Edge Performance: Use your CDN’s analytics to identify edge locations with slower performance and investigate potential issues.
By understanding the relationship between testing server locations and CDN performance, you can not only improve your Core Web Vitals scores but also ensure that these improvements translate to real-world user experience across different geographic regions.
Mobile vs. Desktop: Why Mobile Optimization Should Be Your Priority
When analyzing your Core Web Vitals in tools like PageSpeed Insights, you’ll notice that scores for mobile devices are typically lower than those for desktop computers. This discrepancy isn’t a coincidence—it reflects fundamental differences in how users access content across different devices.
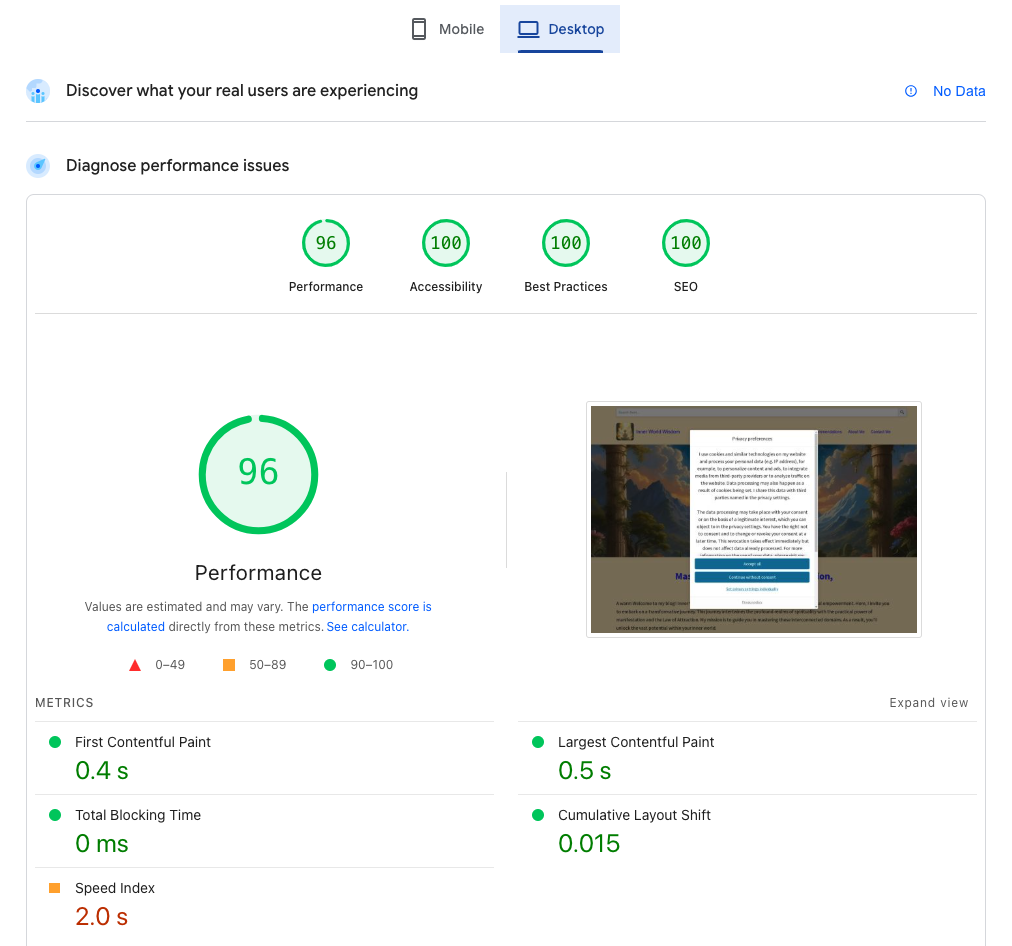
Core Web Vitals for desktop: 5% better than for mobile. Preloaded CDN cache.
Why Mobile Scores Are Generally Lower
- Hardware Limitations: Mobile devices have less processing power, memory, and battery capacity compared to desktop computers. These constraints naturally lead to slower processing of JavaScript, rendering of complex layouts, and loading of resources.
- Network Constraints: Mobile users often browse on cellular networks (3G, 4G, or 5G) rather than stable WiFi connections. These connections can be less reliable, have higher latency, and experience more variability in bandwidth, all of which negatively impact loading times.
- Operating System Differences: Mobile operating systems manage resources differently than desktop systems, often more aggressively throttling background processes and limiting concurrent operations to preserve battery life.
- Cache Limitations: Mobile browsers typically have smaller cache sizes, which reduces their ability to store and quickly retrieve previously downloaded resources.
- Touch Interface Delays: Mobile interfaces add an additional layer of processing for touch inputs compared to mouse clicks, which can contribute to higher interaction delays.
Why Prioritizing Mobile Optimization Makes Business Sense
- Mobile-First Indexing: Google now uses mobile-first indexing, meaning it predominantly uses the mobile version of a site’s content for indexing and ranking. Your mobile performance directly affects your search visibility.
- Traffic Distribution: As of 2024, approximately 60-65% of global web traffic comes from mobile devices. For many industries, especially e-commerce and social media, this percentage is even higher. Optimizing for the majority of your users is simply good business.
- User Expectations: Mobile users have increasingly high expectations for performance but are actually using devices with more constraints. Meeting these expectations despite the technical challenges is crucial for maintaining engagement.
- Competitive Advantage: Many websites still provide suboptimal mobile experiences. Delivering excellent mobile performance can significantly differentiate your site from competitors.
- Lower Tolerance for Poor Performance: Mobile users tend to be more goal-oriented and have less patience for slow-loading sites. Studies show that mobile users are 123% more likely to abandon sites that take more than 10 seconds to load.
Practical Approach to Mobile-First Optimization
When optimizing your website’s Core Web Vitals:
- Analyze Mobile Data First: Always start by examining your mobile performance metrics before looking at desktop scores.
- Test on Real Devices: Emulators and simulations can be helpful, but testing on actual mobile devices with various connection speeds provides the most accurate insights.
- Progressive Enhancement: Build your site using progressive enhancement principles—start with a minimal, functional experience that works well on all devices, then add enhancements for more capable browsers.
- Responsive Images: Implement responsive image solutions that deliver appropriately sized images based on the device’s screen size and resolution.
- Adaptive Loading: Consider implementing adaptive loading techniques that serve different experiences based on the user’s device capabilities and network conditions.
- Mobile-Specific Optimizations: Apply techniques specifically beneficial for mobile users, such as using AMP (Accelerated Mobile Pages) where appropriate, implementing tap-target sizing guidelines, and ensuring mobile-friendly navigation.
Remember that improvements made for mobile performance often benefit desktop users as well, but the reverse isn’t always true. By adopting a mobile-first approach to Core Web Vitals optimization, you’ll ensure that your website delivers a great experience to the majority of your users while satisfying Google’s increasingly mobile-centric ranking criteria.
Conclusions
Core Web Vitals represent Google’s effort to quantify good user experiences on the web, while the additional performance metrics provide a more comprehensive view of your website’s performance. By focusing on all these metrics, you not only improve your search engine rankings but also create websites that users genuinely enjoy using. The benefits extend beyond SEO to include higher engagement, increased conversions, and stronger customer loyalty.
As web technology continues to evolve, staying on top of performance metrics like Core Web Vitals and other page speed factors will remain essential for digital success. Start measuring and optimizing your site today to provide the best possible experience for your users and stay ahead of the competition.
Remember, the goal isn’t just to pass a set of technical benchmarks but to create fast, responsive, and stable web experiences that delight your visitors and keep them coming back for more. By understanding the distinction between Core Web Vitals and other performance metrics, you can prioritize your optimization efforts for maximum impact on both user experience and SEO.